- One week of New York City 311 requests
- Borough, complaint type, time opened, time closed
Learning a method with an agent
DHUM / DATA 70600 · Class 8
The 311 data from Class 1
Closing times by borough
- Do requests close slower in some boroughs?
- Codex can run a statistical comparison in under a minute
Choosing a method
- First, ask which methods fit the question
Learner
I want to know whether requests take longer to close in some boroughs. I'm not a statistician. Which methods could answer this question, and what would each one tell me?
Averages and medians by borough
“A few very slow requests can pull averages upward; medians show the middle request.”
ANOVA
Tests whether average closing times differ across boroughs.
Kruskal–Wallis test
Compares boroughs by ranking closing times, so extreme delays matter less.
Regression with complaint type
“Compare boroughs while accounting for their different mixes of complaints.”
Codex’s advice: “I’d start with summaries, then regression.”
What a regression is
Learner
I have never used regression. Before running anything, tell me in plain words what a regression would do here …
Codex
A regression would compare the time from opening to closing across boroughs. We could first compare borough averages, then include complaint type to ask: Do boroughs still differ when we compare requests with the same recorded complaint type?
From Codex’s walkthrough of the regression
How regression could mislead
- Before running anything, ask what could go wrong
Five ways Codex said it could mislead
- A closed request may not be a resolved problem
- Requests differ in severity and in which agency handles them
- A few very long requests pull the averages up
- Several reports of the same problem count as separate requests
- Requests still open are missing from the file
Predicting, then running the regression
- Write down a guess first, then compare
Learner
My prediction: the Bronx waits longest. … Now run the regression and walk me through each step you took.
Codex
The Bronx had the longest average closure time in this file, but its difference from Manhattan was about 0.26 days.
In one statistics course, predicting first raised correct answers from 16% to 72% (Chance, Garfield and delMas, 2000)
Three numbers in the regression output
| Number | For the Bronx | The question it answers |
|---|---|---|
| The difference in averages | 0.26 days, about 6 hours | How much longer do Bronx requests take than Manhattan’s? |
| The p-value | under 0.001 | Could a gap that size happen by chance? |
| R² | about 1% | How much does knowing the borough tell you about any one request? |
The difference in averages
- Each borough compared with Manhattan
- Bronx average minus Manhattan average
- 3.48 − 3.22 = 0.26 days, about 6 hours
Testing whether the gap could be chance
- If borough made no difference, the labels would be arbitrary
- Shuffle the labels 1,000 times and measure the gap each time
- The real gap, 0.26, never came up by chance
Codex on the p-value: “It is not the probability that ‘there is no difference.’”
How much borough explains
- Both boroughs run from minutes to weeks
- Knowing the borough tells you little about one request's time
- Borough explains about 1% of why some requests take longer than others
- That 1% is R²
Explaining the result yourself
Learner
Here is my explanation: requests in the Bronx take longer because of where they are; the city treats the Bronx worse. What is wrong or missing?
Codex
Your explanation makes a causal claim that this regression cannot establish.
- Write your own explanation of the result
- “Am I right?” invites agreement; “what’s wrong?” invites criticism
Testing regression on made-up data
- Is the Bronx slower, or does it get more slow complaints?
- Codex made up requests, each type equally fast in both boroughs
- The made-up Bronx got more of the slow kind
- Borough alone says the Bronx is 2.4 days slower, which is wrong
- Comparing the same complaint type gives zero, which is right
Statisticians call this fake-data simulation (Gelman, Hill and Vehtari; McElreath)
Adding complaint type
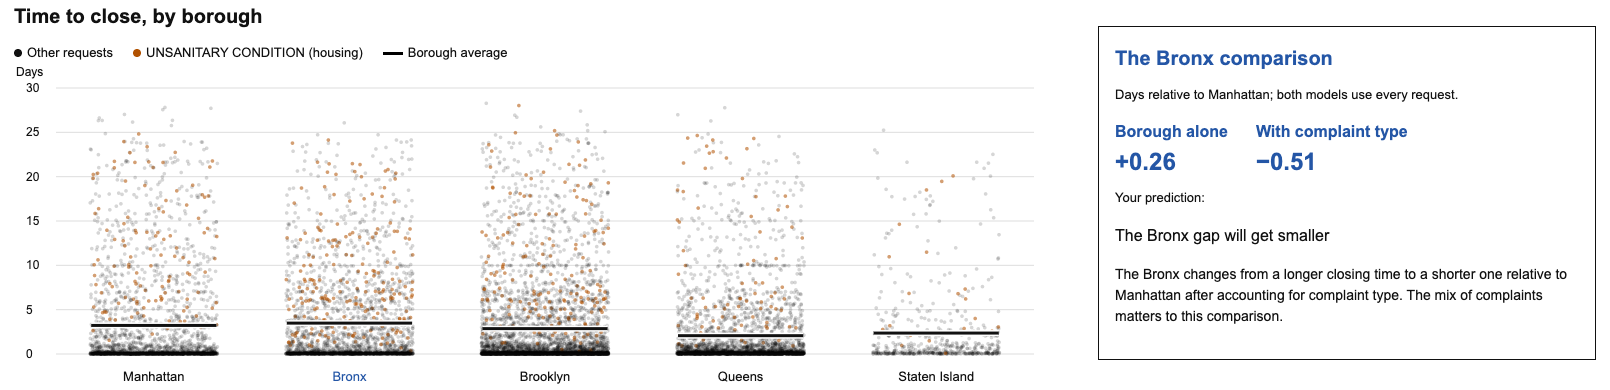
- Borough alone says the Bronx is about 6 hours slower
- Comparing the same complaint type, the Bronx is about 12 hours faster
- The Bronx has more housing complaints, the slowest kind
A page for exploring the result
Open requests and long waits
- Requests still open were left out, and those are the slowest
- Most requests close within hours, a few take weeks
- Those few long waits pull the averages up
Checking Codex's sources
- Codex named the textbook sections it relied on
- Open them to see whether they say what Codex said
- The textbook is free online
What Codex cited
An Introduction to Statistical Learning, the chapters on regression and on survival times
What checking found
The sections are real. One section title was wrong. Codex also missed the section on categories like borough.
Testing yourself without Codex
- Explain the Bronx result the next day, without Codex
- Students who practiced with ChatGPT did worse on exams without it
Questions to ask about any method
- What methods could answer my question?
- What does this method do, in plain words, with my data?
- How could it give me a wrong answer?
- Here is what I expect.
- Run it and walk me through each step.
- What does each number in the output mean?
- Here is my explanation. What is wrong with it?
- Make up data where I know the answer, and run it on that.
- Build me a page where I can change things and see the result.
- Which source are you relying on?
Instructions for Codex
- Codex followed these at every step above
- Use them in your own project, or turn them into a skill as in Class 6
When I ask you to run a statistical method:
Before running it, tell me in plain words what it assumes and how it could give a wrong answer.
Ask me to predict the result before you show it.
After I explain a result, tell me what is wrong or missing in my explanation.
Name the textbook section or documentation page you are relying on.